Pershing Square’s January 2025 presentation valued Fannie Mae at roughly 15.0x earnings and Freddie Mac at 14.5x. Its November 2025 relisting presentation moved Fannie up to 16.0x and Freddie down to 13.0x. The businesses did not suddenly become three turns apart, and the operating record points the other way.
The same business deserves the same multiple. On the evidence, Freddie may deserve more.
01Oksenholt Capital Challenges Pershing Square’s Discounted Freddie Mac Valuation
02Freddie Mac Slide Presentation
The full 19-slide valuation analysis behind the argument above.
03Freddie At a Glance
Why we reject Pershing Square’s lower Freddie multiple. Pershing values Fannie at 16x earnings and Freddie at 13x. We kept its Freddie earnings estimate and changed nothing except the multiple. That one assumption moves a very large amount of value.
- +$10.18Per-share difference versus Pershing’s 13x value
- ~$32.9BFully diluted gap, using ~3.234B FMCC shares
- 3 turnsMultiple gap, 16x versus 13x
Freddie does not belong at 13x
Start with the numbers: the operating record does not support a three-turn gap.
- $7.4BH1 2026 net income for Freddie. Fannie reported $7.7B
- 12.3%Capital efficiency, Freddie Q1 annualized calculation
- 52%2026 issuance, Freddie share. Fannie 48%
The earnings are nearly the same
Fannie earned $7.7 billion in the first half. Freddie earned $7.4 billion. We adjust for reserve movements. Even after that, the three-turn gap does not make sense to us.
Do not overlook the fintech asset
Each company owns half of Common Securitization Solutions. Freddie has fewer shares outstanding. Its shareholders should get full credit for Freddie’s half of that asset.
Freddie now leads new issuance, earns about as much as Fannie and operates under the same regulator and capital rules. Anyone arguing for a lower multiple should have to prove the case.
Capital-efficiency note: Oksenholt calculation annualizes Freddie’s Q1 2026 net income of $3.558B and divides it by average required CET1 of approximately $115.5B, based on $114B at Q4 2025 and $117B at Q1 2026. Result: 12.32%, rounded to 12.3%. This is not a company-reported ROE measure.
The Freddie discount widened
Pershing’s own numbers show the gap moving sharply against Freddie during 2025.
FNMA (Fannie Mae)FMCC (Freddie Mac)
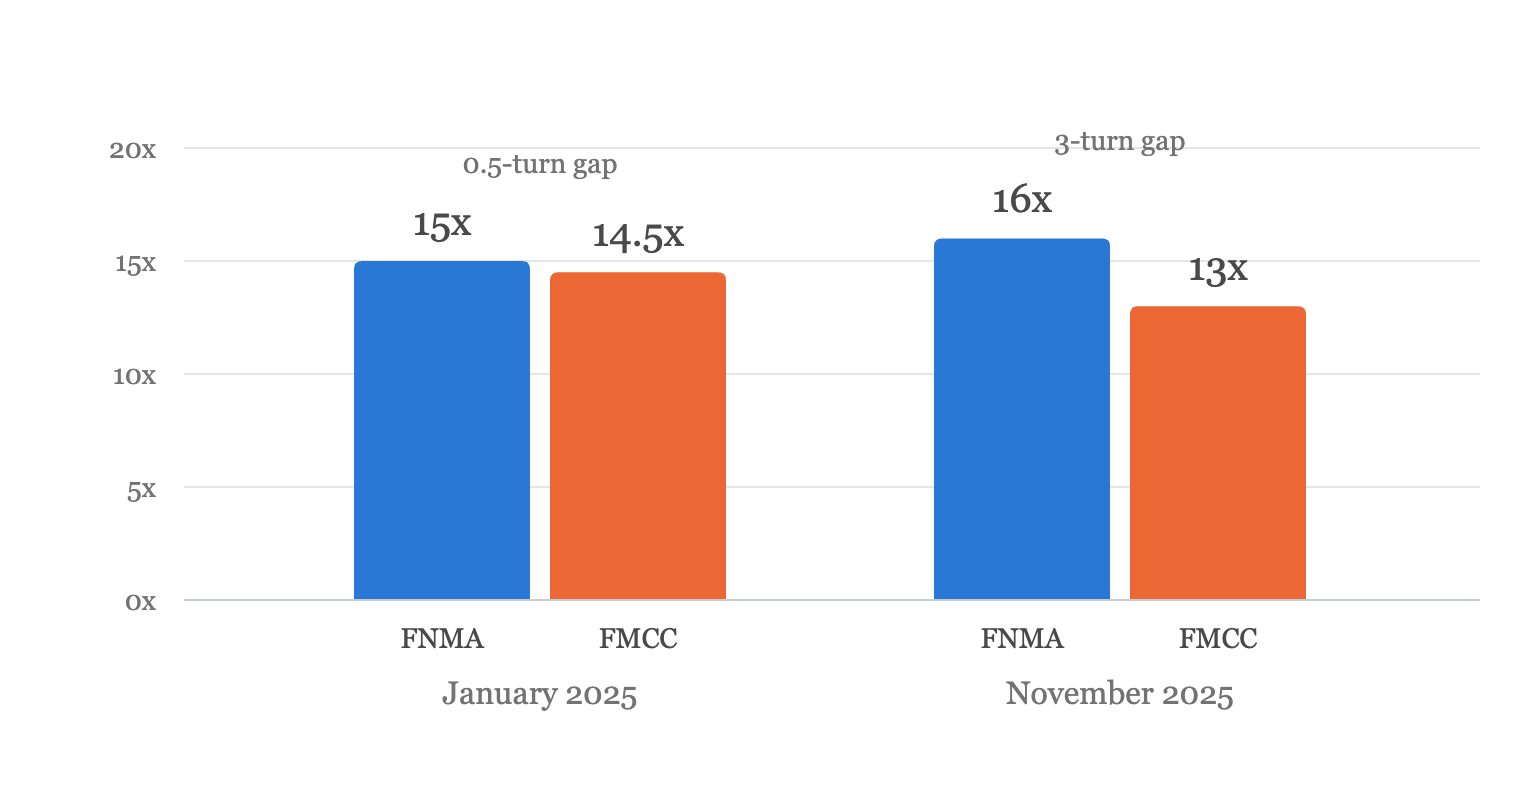
In January, Pershing used 15.0x for Fannie and 14.5x for Freddie. By November, Fannie had moved up to 16x while Freddie had fallen to 13x. A half-turn difference became three turns.
Metric note: Pershing’s January terminal multiples were 15.0x FNMA 2035E EPS and 14.5x FMCC 2035E EPS. The same pages also showed 15.9x FNMA 2027E EPS and 14.6x FMCC 2028E EPS. These are different rows and should not be mixed.
Relisting is only the first step
Freddie must not be marked down before the future is decided. We support the administration and FHFA as they strengthen both companies and work toward ending the Net Worth Sweep and conservatorship. But Freddie’s value cannot be an afterthought.
“I am excited to spend even more time on Fannie Mae and Freddie Mac, as the companies continue the historic ascension under President Trump.”William J. Pulte, Chairman of Fannie Mae and Freddie Mac, August 1, 2026
If the companies stay separate
Value them on the same basis unless the results clearly justify doing otherwise.
If the companies are combined
Establish each company’s standalone value first. Then share the savings created by the merger.
Primary sources: Pershing Square, Fannie Mae and Freddie Mac presentation, 16 January 2025, pp. 88–89 and 94; Pershing Square relisting presentation, 18 November 2025; Fannie Mae and Freddie Mac Q1/Q2 2026 results; FHFA issuance data; CSS corporate information; William J. Pulte post on X, 21 January 2026. For calculations, qualifications and complete source links, see the Oksenholt Capital Freddie Mac Valuation Analysis.
Oksenholt Capital Management LLC · Illustrative only · Not investment advice · DYOR